
September 2026 Labour Market Snapshot
Monthly update on the labour market in Canada’s electricity sector
Utilities employment shows early signs of stabilization in September
Canada’s labour market softened in September, with national employment declining a further 68,000 and the unemployment rate edging up to 6.5%. Although utilities employment continues to shed jobs from the highs observed in spring 2026, the pace of decline slowed considerably in September. Utilities employment fell by 500 workers to 156,100.
Latest measures for the utilities sector: August 2026
| Total employment | 156,100 |
| Monthly change in employment | −0.3% |
| Yearly change in employment | −6.0% |
| Average hourly wage | $55.01 |
About the snapshot
EHRC publishes a monthly labour market update focused on developments in Canada’s electricity sector. Drawing on Statistics Canada’s Labour Force Survey, this snapshot provides sector stakeholders with the latest developments on employment, unemployment, wages and emerging sector trends to support informed workforce and planning decisions.
For more information, visit ehrc.ca/labour-market-intelligence or contact us at [email protected].
Canada at a glance: Mounting declines
Canada’s labour market has experienced a downward trend throughout most of 2026. Employment declined in both January and February before stabilizing in March and declined further in late summer. Employment losses increased from 42,000 jobs in August to 68,000 jobs in September, while the unemployment rate rose slightly from 6.4% to 6.5% over the same period.
Utilities also facing headwinds
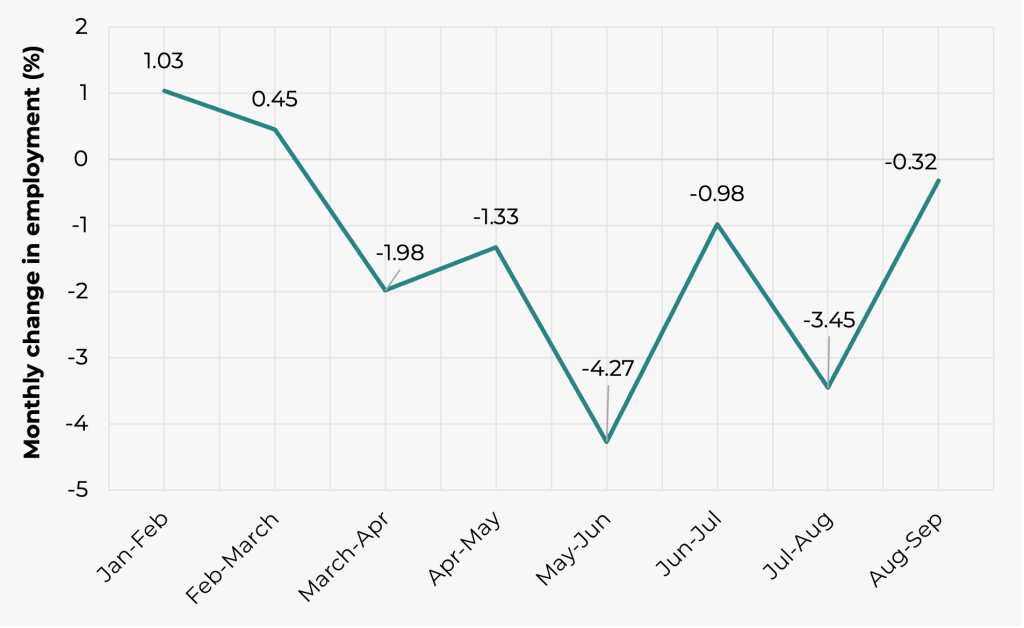
Within the utilities sector, employment followed a similar downward trend. The sector has shed about 10% of its workforce from the 174,300 workers in January to 156,100 workers in September (see Figure 1). However, employment fell by 0.3% in September, compared with 3.5% in August, suggesting that workforce adjustments may be easing.
Figure 1: Monthly percentage change in utilities employment, January to September 2026 (seasonally adjusted)
Source: Statistics Canada, Table 14-10-0355-02
Regional labour market trends remain mixed
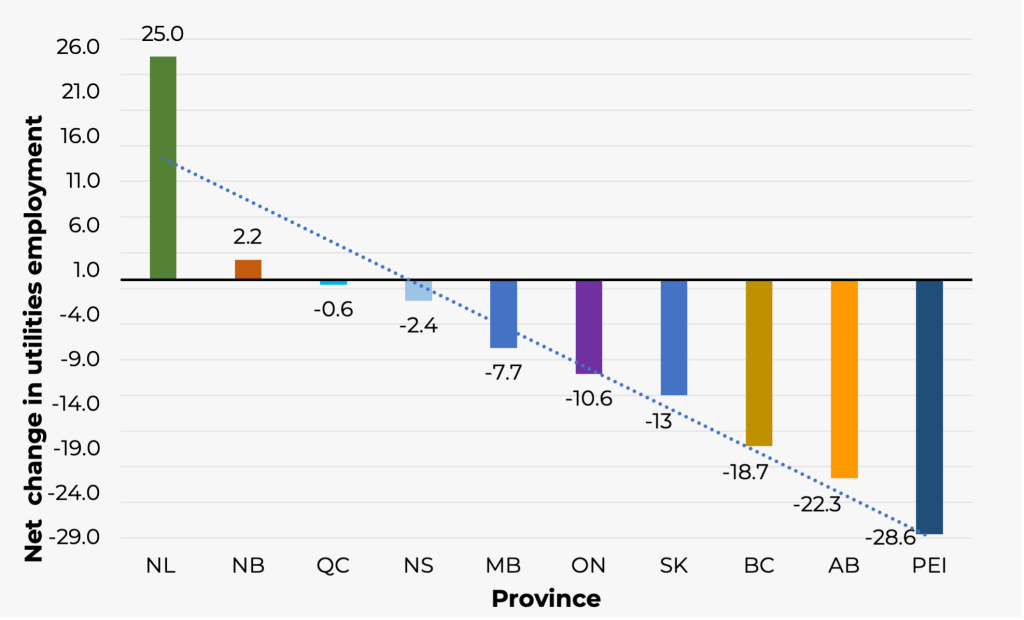
Utilities employment trends varied considerably across provinces between April and September. While national utilities employment declined by approximately 10% over the period, the impact was not evenly distributed across the country (see Figure 2). Newfoundland and Labrador (+25%) and New Brunswick (+2%) recorded net employment growth, while Quebec remained relatively stable (-0.6%).
In contrast, Alberta (-22%), British Columbia (-19%), Saskatchewan (-13%) and Ontario (-11%) experienced significant decreases. These differences suggest that labour market conditions continue to vary across regions and highlight the importance of local workforce planning. PEI recorded the largest decline (-29%), however, this result should be interpreted with caution. The province’s utilities workforce is small, so its estimates are more sensitive to monthly changes.
Figure 2: Percentage change in utilities employment by province, April–September 2026 (seasonally adjusted)
Source: Statistics Canada, Table 14-10-0355-02
Wages vary by gender in the utilities sector
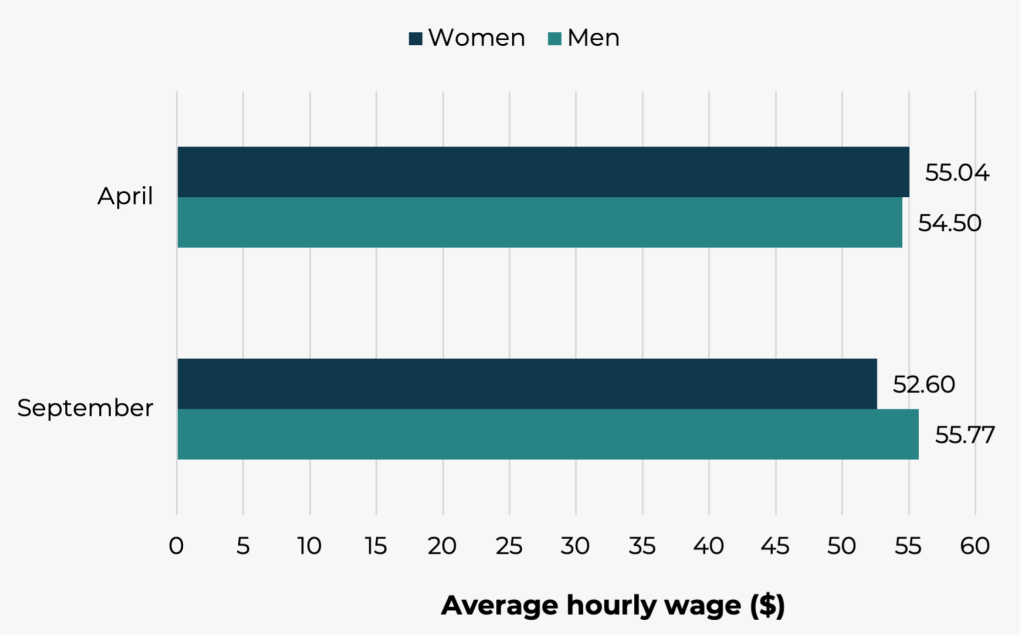
Until summer, average hourly wages for men and women in the utilities sector were broadly similar. The recent job losses may have upset this balance. Labour Force Survey data show that between April and September 2026, average hourly wages for men increased modestly from $54.50 to $55.77, while women’s wages declined slightly from $55.04 to $52.60 (see Figure 3). As a result, the wage gap widened by September, with men earning about $3.17 more per hour on average.
Figure 3: Average hourly wage by gender in the utilities sector, April and September 2026 (not seasonally adjusted)
Source: Statistics Canada, Table 14-10-0063-01
What to watch in coming months
The next Labour Force Survey releases will help establish whether September’s smaller decline marks the beginning of a more stable period or a temporary pause in a longer adjustment.