May 2025 Labour Market Snapshot: Impacts of Tariffs and Policy Shifts
Monthly review of the current labour market in Canada’s electricity sector
The latest
Statistics Canada released the results of its May Labour Force Survey (LFS) on June 6, 2025, a key monthly indicator of employment trends across Canada. The LFS provides insights into national, provincial, territorial, and regional labour market conditions, including employment and unemployment rates.
This report summarizes the key findings from the May 2025 survey, with a particular focus on developments affecting the utilities sector. It also explores the broader economic context, including recent trade tensions, inflation trends and government policy responses.
Economic Context: Trade Tensions and Inflationary Pressures
On April 4, 2025, the United States imposed a 25% tariff on Canadian imports not covered under the Canada–United States–Mexico Agreement (CUSMA), in a move widely criticized as a violation of the agreement. The Trump administration further escalated trade tensions by applying tariffs of 25% on automotive and steel products, and 10% on energy and aluminum. These measures have drawn strong opposition from stakeholders in both countries, including within the electricity sector.
On June 4, the U.S. increased its tariffs on aluminum and steel to 50%, extending them to all countries except the United Kingdom, whose tariff remains at 25%. Canada, the largest supplier of steel and aluminum to the U.S., is particularly affected, accounting for half of U.S. aluminum imports in 2024 and nearly a quarter of steel imports in 2023.[i][ii]
In response, Prime Minister Mark Carney’s newly elected minority Liberal government announced a six-month deferral of most reciprocal tariffs Canada had imposed on U.S imports. The aim is to de-escalate tensions and provide Canadian industries—especially automotive, manufacturing and healthcare—time to adapt their supply chains.[iii]
To cushion the impact on workers, the federal government implemented temporary enhancements to the Employment Insurance program, including higher regional unemployment thresholds, elimination of the waiting period for benefits, and broader eligibility criteria. Several provinces, including Ontario, Manitoba, and Quebec, have also rolled out tax deferrals, tax reductions, or direct financial aid to support affected businesses.
Building Economic Resilience: Interprovincial Trade Reform
To reduce Canada’s reliance on U.S. trade, the federal government has pledged to diversify and expand multilateral trade and enhance domestic economic integration. In 2023, U.S. demand for Canadian exports sustained more than 2.6 million Canadian jobs and nearly 17% of GDP.[iv] Through the recently introduced One Canadian Economy Act, the federal government committed to eliminate barriers to the free movement of goods, services and labour across provinces and territories, in areas where it has jurisdiction, by July 1, 2025.
Currently, interprovincial and territorial trade accounts for over $530 billion annually, roughly 20% of Canada’s GDP.[v] By harmonizing standards, regulations and credential recognition across jurisdictions, the government anticipates improved labour mobility, increased competition and higher productivity. Estimates suggest these reforms could boost Canada’s annual economic output by $200 billion.[vi]
However, implementing such reforms will be complex, challenging and time-consuming, requiring political coordination and collaboration across sectors, jurisdictions and regulatory bodies.
Inflation and Monetary Policy Trends
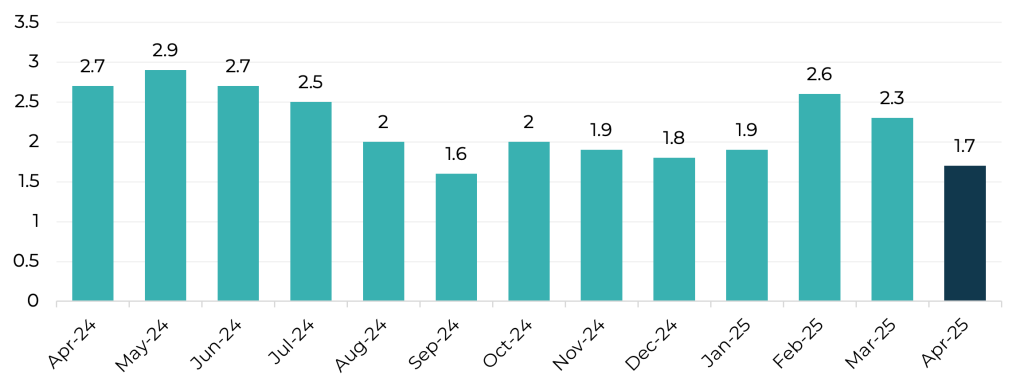
Canada’s annual inflation rate fell from 2.3% in March to 1.7% in April 2025, largely due to the federal government’s elimination of the consumer carbon tax at the start of April.[vii] On June 4, the Bank of Canada said it would maintain its benchmark interest rate at 2.75% following a previous cut from 3.0% in March. The Bank will continue monitoring Canada’s core inflation, trade dynamics and labour market indicators ahead of its next rate decision on July 30.[viii]
Figure 1: Annual Inflation Rate in Canada (%), April 2024-April 2025 [ix]
Labour Market Highlights: May 2025
Between April and May 2025, the Canadian economy added 57,700 full-time jobs but lost 48,800 part-time positions. The labour force grew by 35,300, reaching 22.55 million. Despite this growth, the seasonally adjusted unemployment rate rose from 6.9% to 7.0%—its highest level since 2016, excluding 2020 and 2021 during the COVID-19 pandemic.
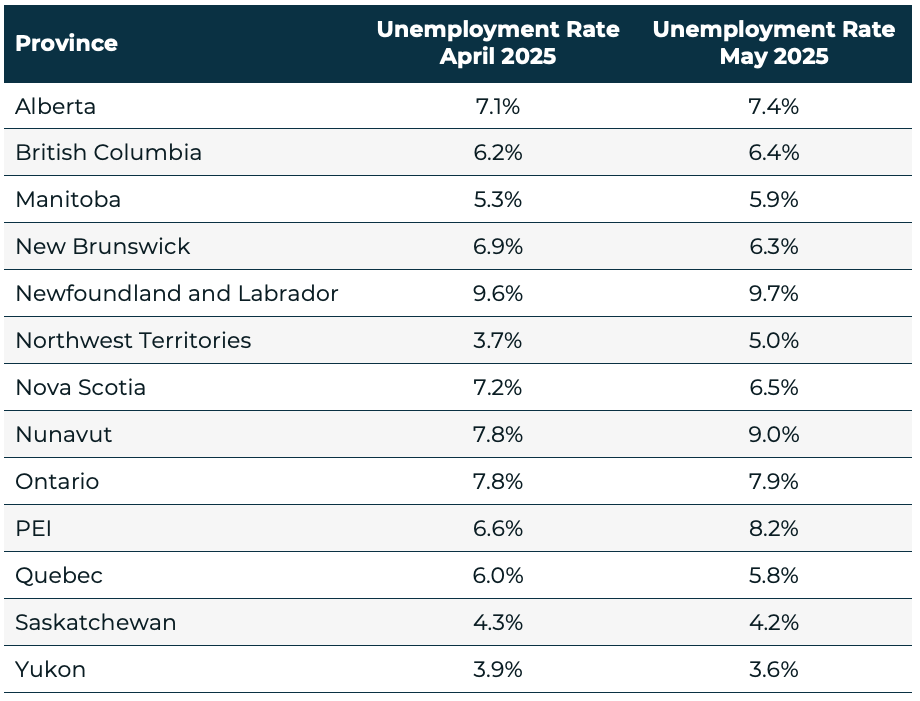
Unemployment rates varied significantly across provinces and territories, ranging from 9.7% in Newfoundland and Labrador to 3.6% in the Yukon (see Table 1). The total number of unemployed Canadians rose to 1.57 million, up 26,500 from April and 13.8% higher than in May 2024.
Job seekers are also facing longer periods of unemployment. In May, the average job search duration was 21.8 weeks, compared to 18.4 weeks a year earlier. This trend is largely attributed to the ongoing trade dispute with the U.S., which has disrupted employment in manufacturing, transportation and warehousing, among other sectors.
Figure 2: Unemployment Rate (%) in Canada (Seasonally Adjusted), May 2023-May 2025 [x]
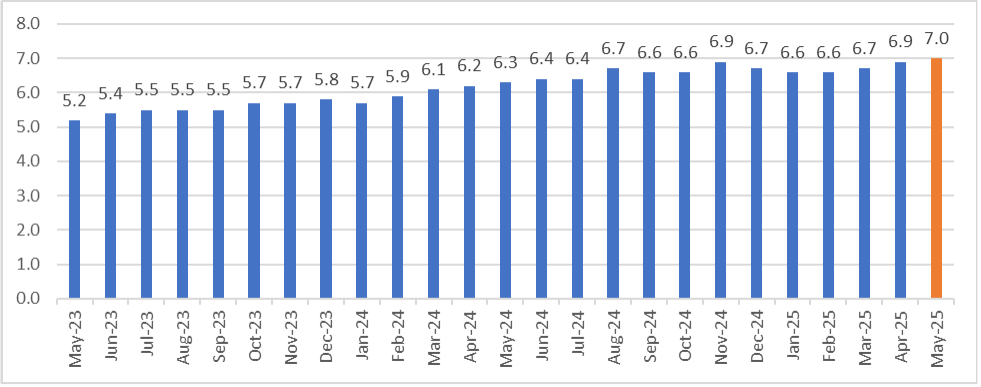
Table 1: Unemployment Rate by Province and Territory (Seasonally Adjusted), April 2025 and May 2025 [xi]
Unemployment by Age, Gender and immigration Status
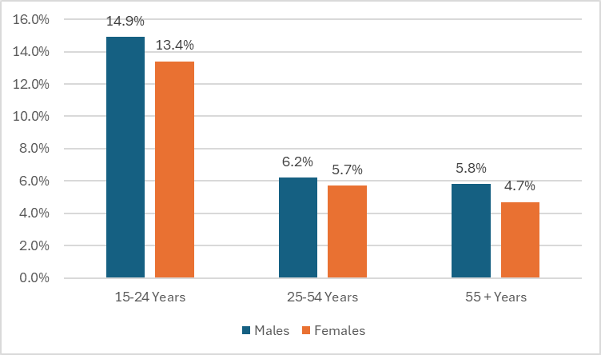
Unemployment rates in May 2025 (illustrated in Figure 3) varied across demographic groups:
- Youth (15-24 years): 9% for men (down from 15.4%) and 13.4% for women (up from 12.7%)
- Core working age (25-54): 2% for men (up from 5.8%) and 5.7% for women (down from 5.8%)
- Older workers (55+): 8% for men (up from 5.7%) and 4.7% for women (down from 4.9%)
- Recent immigrants (within 5 years): 1%, up from 10.6% in April
Figure 3: Unemployment Rate (%) by Age Group and Gender (Canada), May 2025 (Seasonally Adjusted) [xii], [xiii]
Utilities Sector: Employment and Wages
Employment in Canada’s utilities sector rose 3.1% (on a seasonally adjusted basis) from April to May 2025, increasing from 156,100 to 161,000 jobs (Table 2).[xiv] The sector’s unemployment rate stood at 1.6%, down from 1.9% in April.[xv] According to EHRC’s research conducted in 2023, the vast majority of the sector’s employees (approximately 110,600) work in the electricity sub-sector.[xvi]
The largest employment gains were recorded in:
- Quebec:+3,900 jobs (+13.8%)
- Ontario:+1,600 jobs (+2.3%)
- Alberta:+1,000 jobs (+5.1%)
- Saskatchewan:+600 jobs (+10.0%)
Meanwhile, the biggest declines occurred in:
- New Brunswick:-900 jobs (-16.1%)
- British Columbia:-800 jobs (-5.6%)
- Nova Scotia:-400 jobs (-8.3%)
Table 2: Utilities Sector Employment (in 000s) by Province, May 2024, April 2025 and May 2025 (Seasonally Adjusted) [xvii]
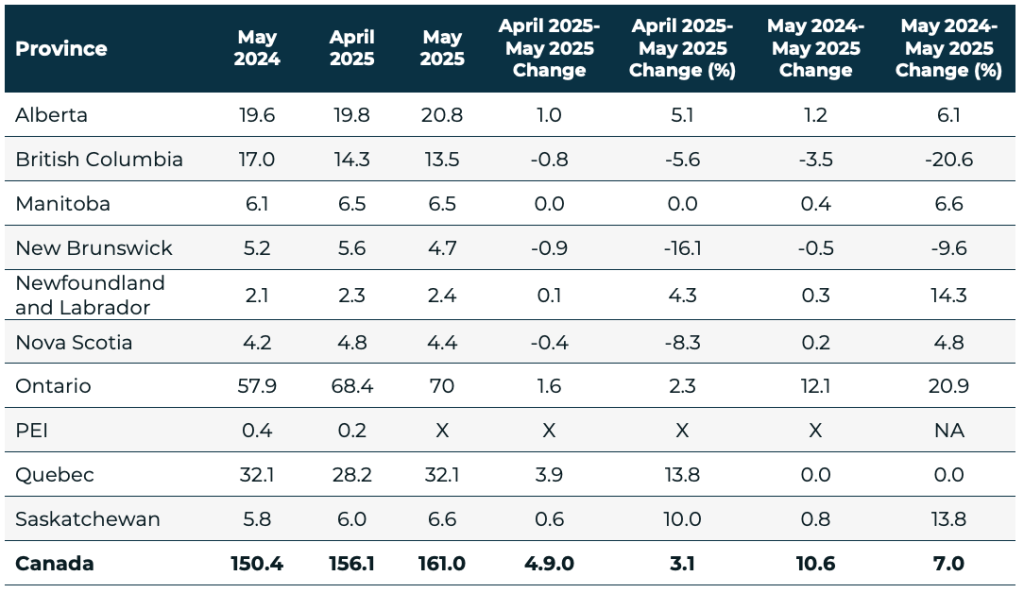
*Please interpret these figures with caution, as EHRC has not independently verified their accuracy.
X: suppressed to meet the confidentiality requirements of the Statistics Act
NA: Not available
In terms of wages, the average weekly earnings in the utilities sector were $2,074 in May 2025—a 2.5% decrease from the previous month ($2,127), but a 5.4% increase relative to one year earlier ($1,967) as seen in Figure 4. Economy-wide average weekly wages remained relatively stable in May ($1,324), virtually unchanged from April ($1,313), but 3.4% higher than May 2024 ($1,281).
Provincial wage averages in the utilities sector ranged from a high of $2,184 in Ontario to a low of $1,755 in Manitoba, 5% above and 15% less than the national average, respectively (Figure 5).
Figure 4: Average Weekly Wage Rates in the Canadian Utilities Sector, May 2024-May 2025 [xviii]
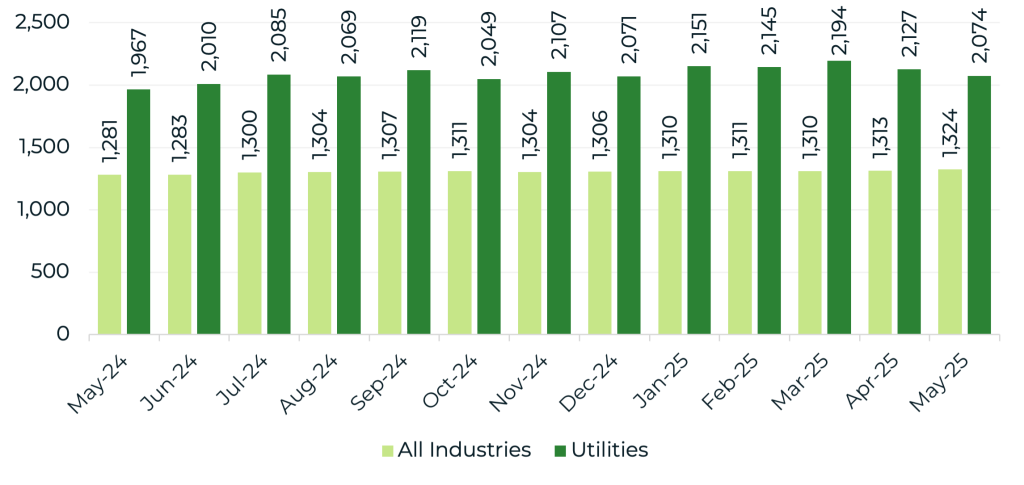
Figure 5: Average Weekly Wage Rates ($) in the Canadian Utilities Sector, by Province, May 2025 [xix]
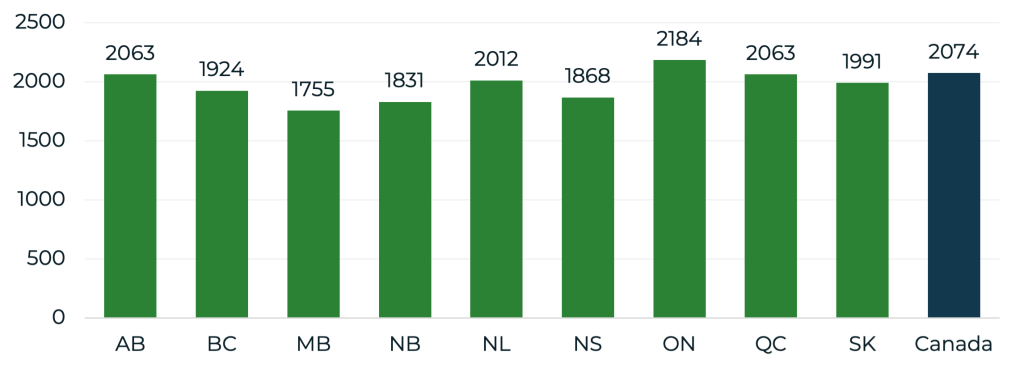
Note: Statistics Canada did not provide wage data for PEI for May.
Endnotes
[i] https://www.cbc.ca/news/world/trump-canada-steel-tariffs-1.7548855
[ii] https://www.auto123.com/en/news/usa-higher-steel-aluminum-tariffs-auto-industry/72847/
[iii]“Canadians keen on tariff retaliation despite recession fears, poll finds”, Montreal Gazette; May 17, 2025
[iv]“Impact of tariffs on businesses in Canada: Expectations and strategic responses, second quarter of 2025”, Shivani Sood, June 9, 2025
[v]https://www.cfta-alec.ca/committee-on-internal-trade-ministers-take-action-to-make-significant-progress-on-reducing-internal-trade-barriers
[vi]“B.C. lifts two interprovincial trade restrictions ahead of expected U.S. tariffs; The Globe and Mail (Online), February 28, 2025
[vii]“Bank of Canada rate cut odds for June fall after April inflation data”, Canadian Press, May 20, 2025
[viii]The core rate of inflation excludes the effects of taxes, as well as transitory or sector-specific fluctuations in some components of the consumer price index.
[ix]https://www.bankofcanada.ca/rates/price-indexes/cpi/
[x]Statistics Canada. Table 14-10-0287-01 Labour force characteristics, monthly, seasonally adjusted and trend-cycle
[xi]Statistics Canada. Table 14-10-0287-01 Labour force characteristics, monthly, seasonally adjusted and trend-cycle
[xii]https://www150.statcan.gc.ca/n1/pub/14-20-0001/142000012018001-eng.htm
[xiii]Statistics Canada. Table 14-10-0287-03 Labour force characteristics by province, monthly, seasonally adjusted
[xiv]Statistics Canada. Table 14-10-0355-01 Employment by industry, monthly, seasonally adjusted and unadjusted, and trend-cycle, last 5 months (x 1,000)
[xv]Statistics Canada. Table 14-10-0022-01 Labour force characteristics by industry, monthly, unadjusted for seasonality
[xvi]“Electricity in Demand: Labour Market Insights 2023-2028”, EHRC, 2023
[xvii]Statistics Canada. Table 14-10-0355-01 Employment by industry, monthly, seasonally adjusted and unadjusted, and trend-cycle, last 5 months (x 1,000)
[xviii]Statistics Canada. Table 14-10-0063-01 Employee wages by industry, monthly, unadjusted for seasonality
[xix]Statistics Canada. Table 14-10-0063-01 Employee wages by industry, monthly, unadjusted for seasonality