July 2025 Labour Market Snapshot
Monthly review of the labour market in Canada’s electricity sector
The Latest
Statistics Canada released the results of its July Labour Force Survey (LFS) on Aug. 8, 2025, a key monthly indicator of employment conditions across Canada. The LFS provides insights into national, provincial and territorial labour market trends, including employment levels and unemployment rates.
This report highlights the key findings of the July 2025 survey, with a particular focus on developments affecting Canada’s utilities sector. It also explores the broader economic context shaping workforce dynamics, including bilateral trade tensions, inflationary pressures and recent policy responses. By connecting sector-specific findings to this wider landscape, this report aims to clarify how macroeconomic shifts are influencing labour market outcomes for utilities employers and workers alike.
Economic Context: Trade Tensions and Inflationary Pressures
Canada’s trade landscape in mid-2025 has been shaped by ongoing tariff disputes and supply chain uncertainties. In July, the United States continued its tariffs on Canadian steel and aluminum products and added new duties on certain electrical equipment, including transformers and switchgear.[1] These measures have raised costs for Canadian utilities and manufacturers dependent on cross-border supply chains.[2]
Meanwhile, global tensions in renewable energy markets have added more pressure. Tariffs from the European Union and the U.S. on solar panels and battery components have indirectly affected Canadian companies through higher input costs and delays in equipment procurement. For utilities, especially in provinces with aggressive clean energy targets, this has led to delays in projects and, in some cases, workforce adjustments.[3]
In response, Canadian policymakers have reaffirmed commitments to domestic manufacturing incentives and are exploring targeted tariff relief on critical infrastructure components. These efforts may help ease pressures over time, but they are unlikely to fully eliminate the challenges posed by rising import costs.
Inflation and Monetary Policy Trends
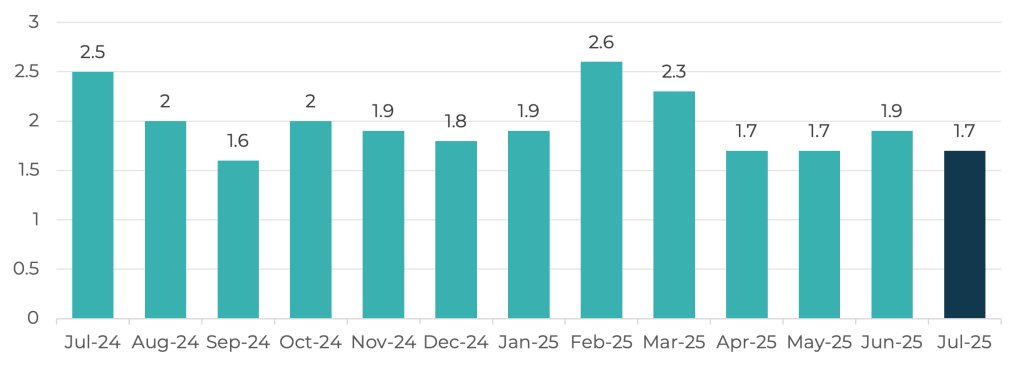
Canada’s inflation rate dipped slightly in July, with the Consumer Price Index (CPI) falling from 1.9% to 1.7%. However, “core” inflation—which excludes more volatile items like food and energy—stayed higher at around 2.5%, above the Bank of Canada’s 2% target.[4]
The Bank of Canada says the recent slowdown is mostly due to lower energy prices. Still, it warns that tariff-driven increases in import costs and persistent service-sector price pressures still pose inflationary risks. According to its estimates, about 75% of tariff-related cost hikes are passed on to consumers within six quarters.[5]
Because of these risks, the Bank announced it would maintain its key interest rate steady at 2.75% in its July 30 announcement, remaining unchanged since March 12, 2025. This cautious approach reflects a balancing act: acknowledging the recent dip in inflation while staying alert to possible price increases driven by trade tensions, supply chain costs and labour market pressures. The next rate decision is expected in early September.
Figure 1: Annual Inflation Rate in Canada (%), July 2024-July 2025[6]
Labour Market Highlights: July 2025
Canada’s job market showed signs of strain in July, with the economy losing 51,500 full-time positions. This decline was partially offset by the addition of 10,300 new part-time positions, resulting in a net reduction of 33,000 workers in the overall labour force, which now stands at 22.58 million. Despite these shifts, the unemployment rate held steady at 6.9%, supported by seasonal adjustments.
While employment is up by 307,500 compared to July 2024, the pace of job growth has slowed, and the number of unemployed Canadians has risen to 1.56 million—a 9.5% increase from a year earlier. Of particular concern is the rise in long-term unemployment, with nearly one in four unemployed people (23.8%) having been actively seeking work for six months or more. This marks the highest rate of long-term unemployment since February 1998, excluding the pandemic years.
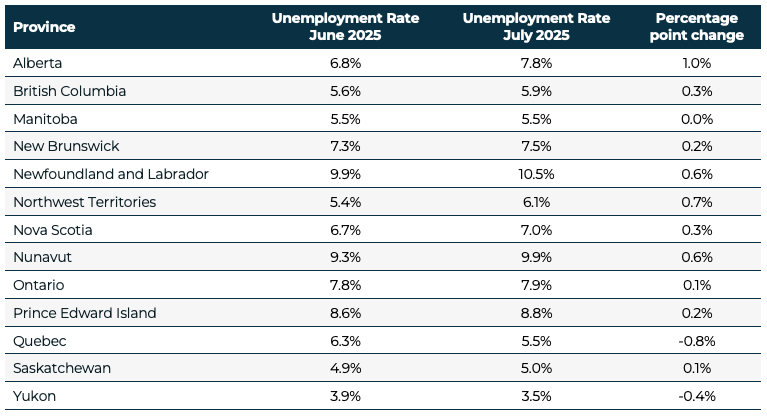
Unemployment rates varied significantly across the country:
- Highest: Newfoundland and Labrador at 10.5%
- Lowest: Yukon at 3.5%
The largest monthly increases occurred in:
- Alberta: +1.0 percentage points
- Newfoundland and Labrador: +0.6 percentage points
Meanwhile, declines were recorded in:
- Quebec: -0.8 percentage points
- Yukon: -0.4 percentage points
Figure 2: Unemployment Rate (Seasonally Adjusted) in Canada (%), July 2024-July 2025[7]
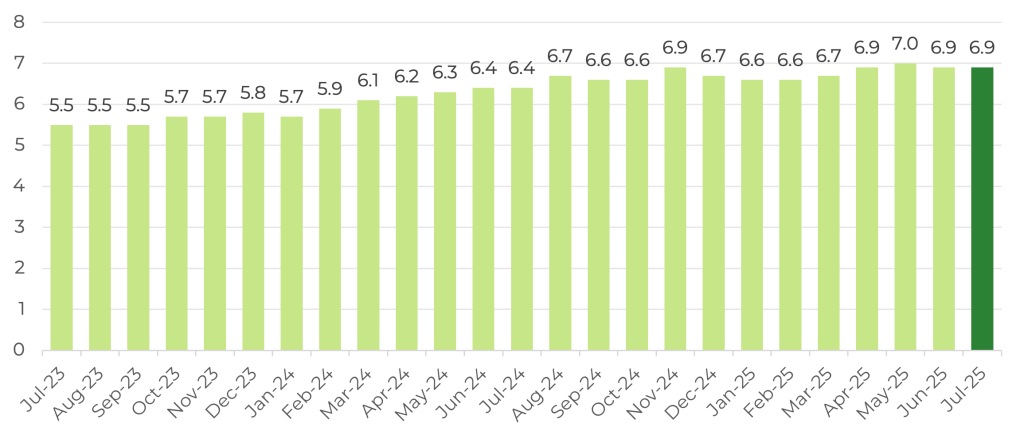
Table 1: Unemployment Rate by Province and Territory, June 2025 and July 2025 (Seasonally Adjusted)[8]
Unemployment by Age, Gender and immigration Status
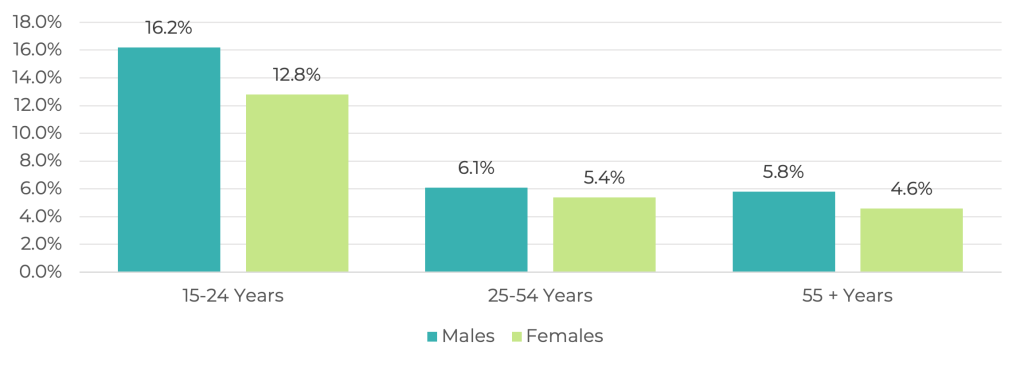
Unemployment rates in June 2025 (illustrated in Figure 3) varied across demographic groups:
- Youth (15–24): Unemployment rose for young men (16.2%, up from 14.7%) but fell for women (12.8%, down from 13.7%).
- Core working-age adults (25–54): Rates were stable—6.1% for men and 5.4% for women.
- Older workers (55+): Unemployment ticked up slightly for men (5.8%, from 5.6%) and dipped for women (4.6%, from 5.0%).
- Recent immigrants (within 5 years): Unemployment rose from 10.9% in June to 11.2% in July.
The rise in long-term unemployment among older workers and newcomers highlights the need for inclusive workforce development strategies and reskilling initiatives.
Taken together, these trends suggest a labour market under pressure. Job growth is slowing, fewer people are participating in the workforce and long-term unemployment is rising. Even though inflation has eased slightly, these employment challenges help explain why the Bank of Canada is staying cautious. Higher costs from tariffs may not yet show in consumer prices, but they’re already affecting jobs—adding to the uncertainty facing households, businesses and policymakers.
Figure 3: Unemployment Rate (%) by Age Group and Gender (Canada), July 2025 (Seasonally Adjusted)[9], [10]
Utilities Sector: Employment and Wages
In July 2025, employment in Canada’s utilities sector dropped slightly, down 0.3% from June (on a seasonally adjusted basis), falling from 159,300 to 158,800 positions. Interestingly, the sector’s unemployment rate also dropped slightly, from 2.5% to 2.3%, reflecting a modest contraction in the labour force. According to EHRC’s 2023 research, the majority of the sector’s workers (approximately 110,600) are employed in the electricity industry.
Job trends varied across provinces. Gains were strongest in:
- Quebec: +1,700 jobs (+5.1%)
- British Columbia: +1,500 jobs (+12.4%)
- Nova Scotia: +600 jobs (+14.6%)
Declines were most notable in:
- Ontario: -4,000 jobs (-5.8%)
- Alberta: -400 jobs (-2.0%)
- New Brunswick: -200 jobs (-4.3%)
Despite the monthly dip, the sector is still ahead of where it was last year—up 3.9% compared to July 2024, when there were 152,800 jobs.
When it comes to wages, the average weekly earnings in the utilities sector were $2,096 in July, a 0.4% decrease from June ($2,105) and a 0.5% decline from a year ago ($2,085). For comparison, the average weekly wage across the economy was $1,338, which has remained fairly steady from both June ($1,322) and July 2024 ($1,300).
Across provinces, wages in the utilities sector ranged widely:
- Highest: Alberta at $2,325 (10.9% above the national average
- Lowest: Manitoba at $1,718 (about 18% below)
Data for PEI wasn’t published due to confidentiality requirements.
Overall, the sector is showing uneven provincial dynamics—strong job growth in Quebec, British Columbia and Nova Scotia, but notable losses in Ontario, Alberta and New Brunswick. Wage growth has dipped slightly, reflecting broader economic pressures like rising costs and trade-related challenges. These factors are especially important for utilities companies planning major infrastructure projects, where equipment costs and workforce needs are closely tied to global supply chains and policy decisions.
Table 2: Utilities Sector Employment (in 000s) by Province, July 2024, June 2025 and July 2025 (Seasonally Adjusted)[11]
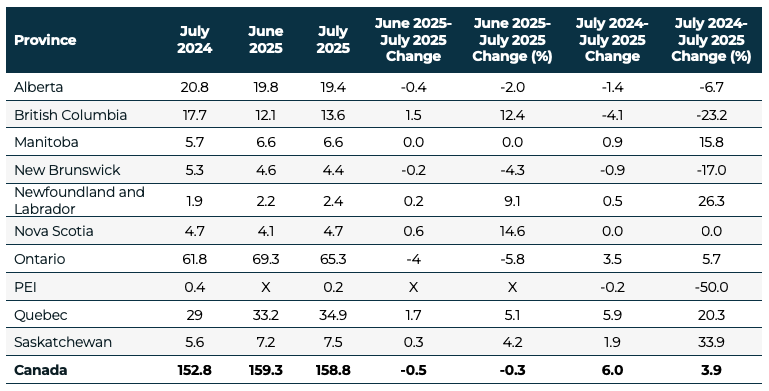
*Please interpret these figures with caution, as EHRC has not independently verified their accuracy.
X: suppressed to meet the confidentiality requirements of the Statistics Act
Figure 4: Average Weekly Wage Rates in the Canadian Utilities Sector, July 2024-July 2025[12]
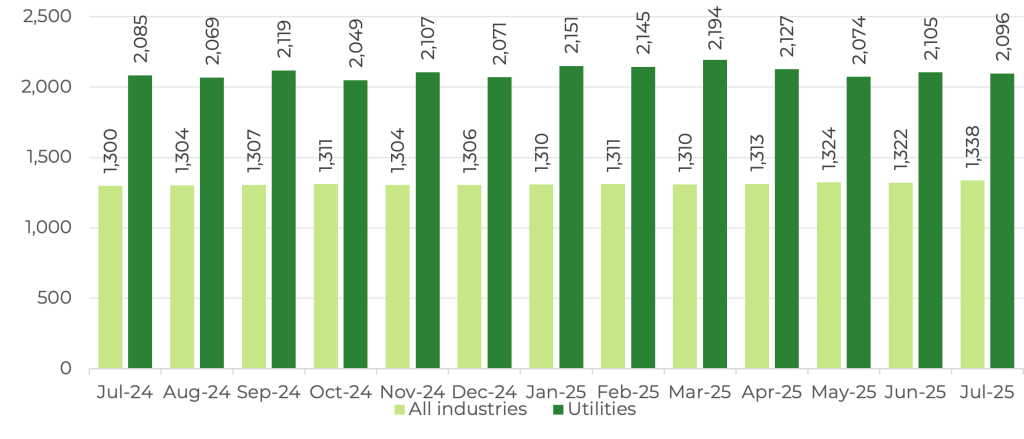
Figure 5: Average Weekly Wage Rates ($) in the Canadian Utilities Sector, by Province, July 2025[13]
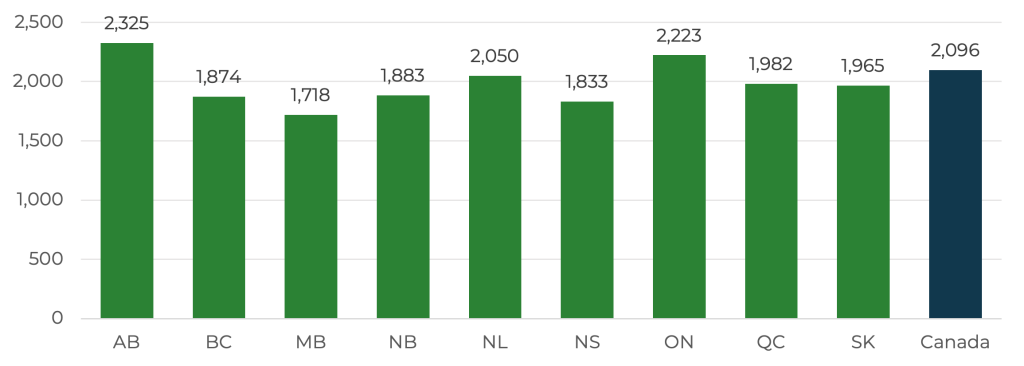
Note: Statistics Canada did not provide wage data for PEI for June.
Endnotes
[1] https://budgetlab.yale.edu/research/state-us-tariffs-july-28-2025
[2] G&C Logistics. (2025, June 20). U.S.-Canada steel & aluminum tariffs 2025: What Canadian businesses need to know. Retrieved from G&C Logistics website
[3] My Solar Solutions. (2025, February 16). How will tariffs impact the Canadian solar industry? Retrieved from My Solar Solutions website
[4] Core inflation refers to the rate at which prices are rising in an economy, excluding the most volatile components—food and energy.
[5] https://www.bankofcanada.ca/2025/06/staff-analytical-note-2025-18/
[6] https://www.bankofcanada.ca/rates/price-indexes/cpi/
[7] Statistics Canada. Table 14-10-0287-01 Labour force characteristics, monthly, seasonally adjusted and trend-cycle
[8] Statistics Canada. Table 14-10-0287-01 Labour force characteristics, monthly, seasonally adjusted and trend-cycle
[9] https://www150.statcan.gc.ca/n1/pub/14-20-0001/142000012018001-eng.htm
[10] Statistics Canada. Table 14-10-0287-03 Labour force characteristics by province, monthly, seasonally adjusted
[11] Statistics Canada. Table 14-10-0355-01 Employment by industry, monthly, seasonally adjusted and unadjusted, and trend-cycle, last 5 months (x 1,000)
[12]Statistics Canada. Table 14-10-0063-01 Employee wages by industry, monthly, unadjusted for seasonality
[13]Statistics Canada. Table 14-10-0063-01 Employee wages by industry, monthly, unadjusted for seasonality