
June 2026 Labour Market Snapshot
Monthly update on the labour market in Canada’s electricity sector
Stable labour market conditions with continued utilities softening
Overall employment was little changed in June, while the unemployment rate edged down 0.1 percentage points to 6.5%. Beneath this stability, however, there was considerable variation across sectors. Employment in service-producing industries increased, while employment in goods-producing industries declined. Utilities employment fell by 7,300 in June (−4.3%) but remained 3,900 (+2.4%) above June 2025.
Latest measures for the utilities sector: June 2026
| Total employment (utilities) | 163,800 |
| Monthly change in employment | -4.3% |
| Yearly change in employment | +2.4% |
| Average hourly wage | $56.36 |
About the snapshot
EHRC publishes a monthly labour market update focused on developments in Canada’s electricity sector. Drawing on Statistics Canada’s Labour Force Survey, this snapshot provides sector stakeholders with the latest developments on employment, unemployment, wages and emerging sector trends to support informed workforce and planning decisions.
For more information, visit ehrc.ca/labour-market-intelligence or contact us at [email protected].
Canada at a glance: Slower employment gains
Canada’s labour market showed signs of stabilizing in June following stronger gains in May. Employment increased by 18,200, broadly keeping pace with more modest growth in the working-age population. This suggests that the increase was largely driven by population growth, rather than reflecting a change in the share of Canadians who were employed. Even so, the unemployment rate edged down to 6.5%, supported by a decline in youth unemployment as summer hiring improved.
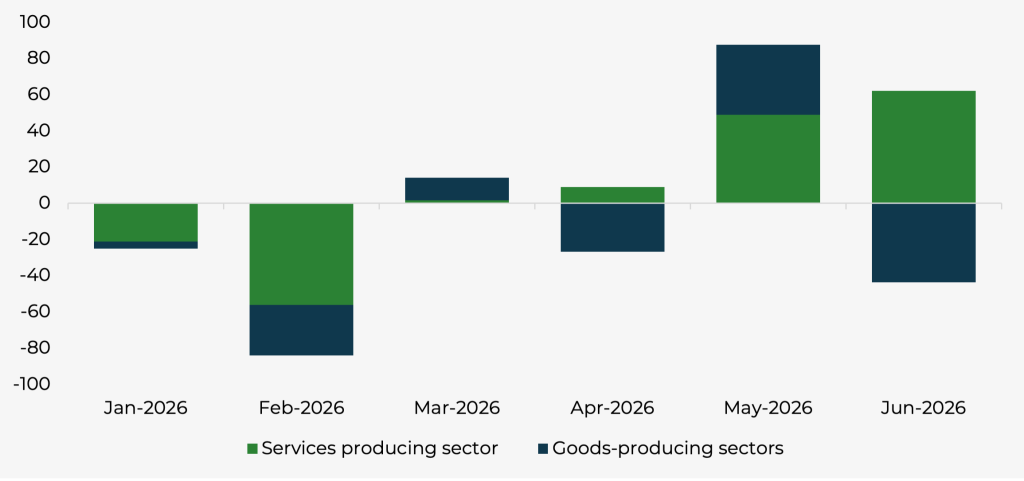
Beneath this relatively stable headline, however, labour market conditions varied across industries. Employment gains were concentrated in service-producing sectors, while goods-producing industries gave back much of the employment growth recorded in the previous month (Figure 1). Employment in service-producing industries increased by 62,100, led by wholesale and retail trade as well as accommodation and food services. In contrast, employment in goods-producing industries declined by 43,600, reflecting broad-based weakness across several sectors. This divergence highlights the uneven nature of labour market adjustment across sectors despite little change in overall employment.
Figure 1: Monthly change in total employment for 2026 by sector, thousands, seasonally adjusted
Source: Statistics Canada, Table 14-10-0355-02
Continued softening in utilities employment
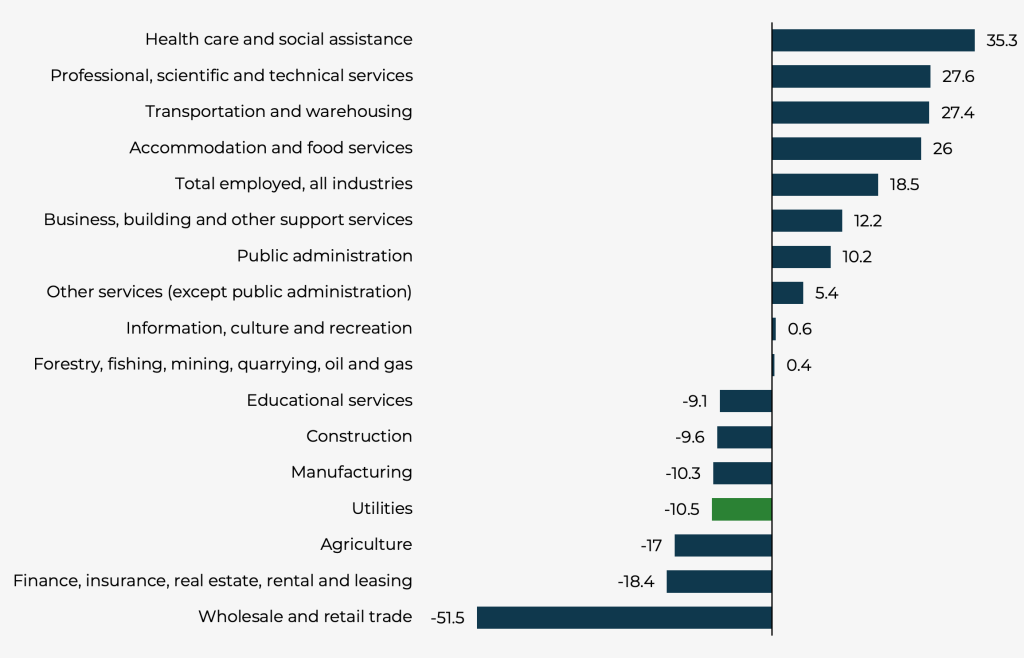
Utilities employment continued to weaken in June, falling by 7,300 to 163,800 and recording a third consecutive monthly decline. The sector has shed a cumulative 10,500 jobs since January 2026, pointing to emerging signs of easing (Figure 2). Utilities recorded the fourth-largest year-to-date employment decline among major industries. However, its decline was considerably smaller than those recorded in wholesale and retail trade, finance and agriculture.
Figure 2: Year-to-date change in employment in Canada by sector, June 2026, thousands
Source: Statistics Canada, Table 14-10-0355-02
Nevertheless, utilities employment remains above its level a year ago, up 3,900 positions, suggesting that the recent pullback follows a period of stronger growth rather than a sustained contraction.
The June decline was concentrated in Ontario (−3,400), Alberta (−1,900) and British Columbia (− 1,400), which together accounted for most of the sector’s employment losses.
While the Labour Force Survey measures total employment for the entire utilities sector (NAICS 22), another source of data, the Survey of Employment, Payrolls and Hours (SEPH), provides measures of payroll employment specific to the electricity sector (NAICS 2211). The trade-off is that this alternative source is slightly less timely, with an additional two-month lag.
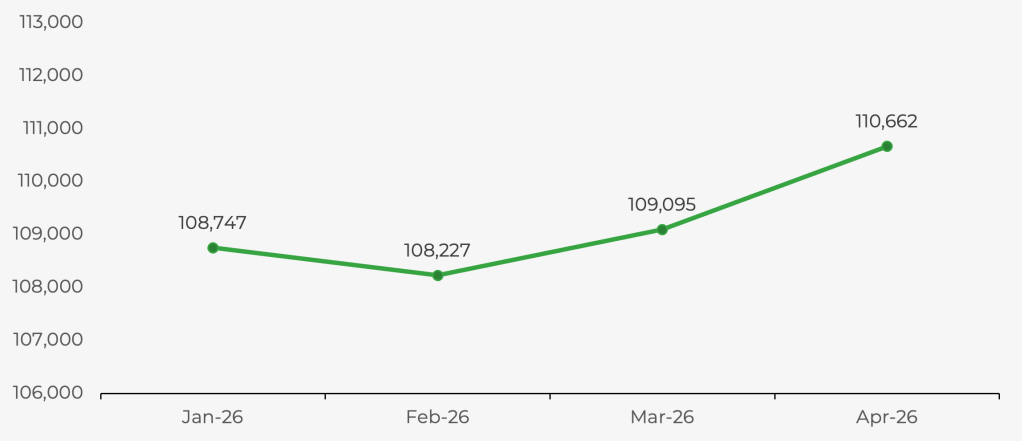
Payroll employment in the electricity sector rose to 110,662 in April, its highest level in five months, following some cooling earlier in the year. Although SEPH and the LFS measure different concepts and cover different populations, the results suggest that the recent weakness may be concentrated outside the core electricity industry or may have emerged after April. SEPH indicates that payroll employment in the electricity industry remained relatively stable through the spring, whereas the timelier LFS shows that employment across the broader utilities sector has declined since March 2026 (Figure 3).
Figure 3: Payroll employment for electric power generation, transmission and distribution sector
Source: Statistics Canada, Table 14-10-0220-01
What to watch next month
The next release will help clarify whether the recent pullback in utilities employment marks a period of normalization following earlier gains or signals a more persistent softening in the sector.