August 2025 Labour Market Snapshot
Monthly review of the labour market in Canada’s electricity sector
The latest
Statistics Canada released the results of its August Labour Force Survey (LFS) on Sept. 5, 2025, a key monthly indicator of employment conditions across the country. The LFS provides insight into national, provincial and territorial labour market trends, including employment levels and unemployment rates.
This report highlights the key findings of the August 2025 survey, with a particular focus on the developments affecting Canada’s utilities sector. It also explores the broader economic context shaping workforce dynamics, including bilateral trade tensions, inflationary pressures and recent policy responses. By connecting sector-specific findings to this broader context, the summary clarifies how macroeconomic shifts are influencing labour market outcomes for utilities sector employers and workers alike.
Economic Context
Canada’s trade landscape remained strained in late summer 2025, driven by intensifying tariff disputes and ongoing supply chain disruptions. In August, the United States increased tariffs on a wide range of Canadian imports from 25% to 35%, citing national security concerns. This move has intensified cost pressures for Canadian manufacturers, particularly in steel, aluminum and automotive sectors, where cross-border supply chains are critical to production.[1]
Labour market data for August reveals substantial job losses in trade-sensitive sectors, including manufacturing (-19,000 jobs), transportation and warehousing (-23,000 jobs), and professional services (-26,000 jobs). These declines were concentrated among core-aged workers (25–54), highlighting the vulnerability of Canada’s industrial workforce to global trade instability.
In response, the federal government unveiled a targeted support package to bolster domestic resilience.[2] Key measures include:
- A $5 billion Strategic Response Fund to support industries affected by tariffs
- Expanded financing access for small and medium-sized enterprises (SMEs)
- A new “Buy Canadian” procurement framework to strengthen domestic supply chains
While these initiatives aim to mitigate long-term risks, they are unlikely to fully offset the immediate labour market impacts caused by rising import costs and continued trade uncertainty.
Inflation and Monetary Policy Trends
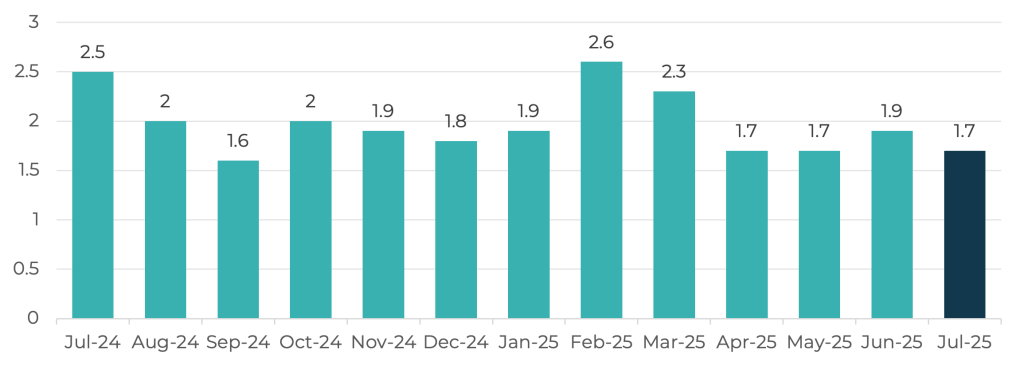
Canada’s inflation rate dipped slightly in July, the latest month on record, with the Consumer Price Index (CPI) declining to 1.7% from 1.9% in June. However, core inflation—which excludes more volatile items like food and energy—stayed higher at around 2.5%, above the Bank of Canada’s 2% target. Policymakers continue to identify trade-related cost pressures as a potential trigger for renewed inflation, reinforcing the Bank’s cautious posture heading into its September rate decision.
The Bank of Canada held its benchmark interest rate at 2.75%, citing easing energy prices as the primary driver behind softer inflation readings. However, the Bank continued to flag tariff-related import costs and persistent service-sector price pressures as ongoing risks. This cautious approach reflects a balancing of near-term disinflation with concerns over trade-driven price acceleration. A further assessment is expected with the Bank’s September policy announcement.
Figure 1: Annual Inflation Rate in Canada (%), July 2024-July 2025[3]
Labour Market Highlights: August 2025
Canada’s labour market continued to weaken in August, with employment falling by 66,000, following a 41,000-job decline in July. The seasonally adjusted unemployment rate rose to 7.1%, up from 6.9% the previous month, reaching the highest level since May 2016, excluding the pandemic period. The number of unemployed Canadians increased by 34,000, bringing the total to 1.6 million.
Long-term unemployment remains a persistent concern: 23.8% of unemployed individuals had been actively seeking work for 27 weeks or more, a rate not seen since early 1998 (excluding 2020–2021).[4]
Employment losses were concentrated among core-aged workers (25-54), who saw a decline of 93,000 positions.[5] Most of the drop was in part-time employment; full-time employment remained stable.
Regional Trends
Unemployment rates varied widely across provinces and territories:
- Highest: Newfoundland and Labrador at 10.7%
- Lowest: Yukon at 4.2%
Notable monthly changes:
- Increases: Yukon (+0.7), Alberta (+0.6) and Quebec (0.5)
- Declines: Northwest Territories (-0.7), Prince Edward Island (-0.7) and Nova Scotia (-0.5)
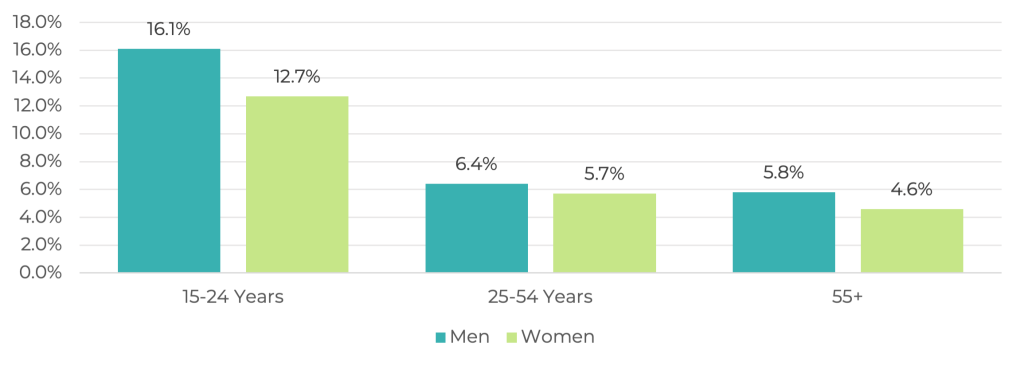
Demographic Insights [6]
Youth (15–24):
- Men: 1% (down from 16.2%)
- Women: 7% (down from 12.8%)
Core-aged adults (25–54):
- Men: 6.4% (up from 6.1%)
- Women: 5.7% (up from 5.4%)
Older workers (55+):
- Men: 5.8% (unchanged)
- Women: 4.6% (unchanged)
Recent immigrants (within 5 years):
- Unemployment rose from 11.2% in July to 11.4% in August
Figure 2: Unemployment Rate (Seasonally Adjusted) in Canada (%), August 2023-August 2025[7]
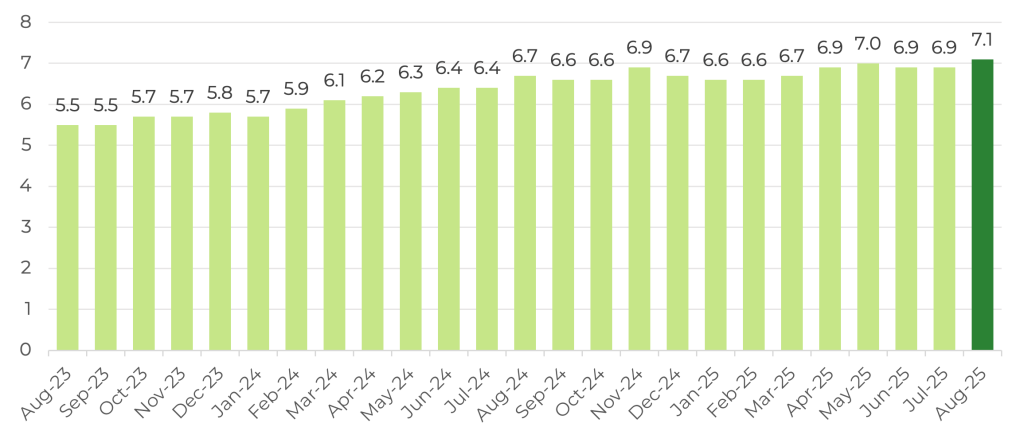
Table 1: Unemployment Rate by Province and Territory, July 2025 and August 2025 (Seasonally Adjusted)[8]
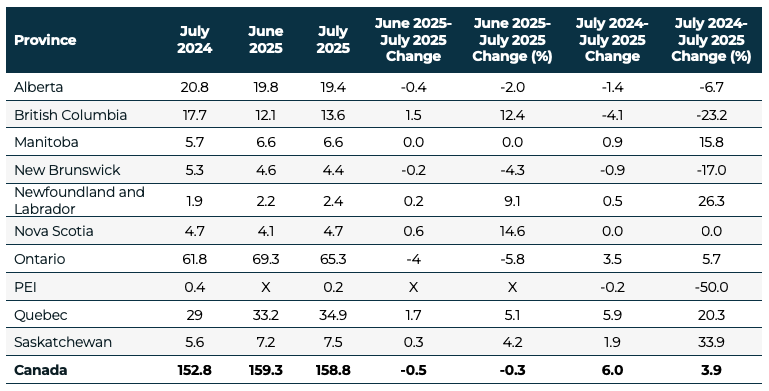
Figure 3: Unemployment Rate (%) by Age Group and Gender (Canada), August 2025 (Seasonally Adjusted)[9], [10]
Utilities Sector: Employment and Wages
Employment in Canada’s utilities sector rose to 163,500 in August 2025, an increase of 4,700 jobs (+3.0%) from July. Compared to August 2024, the sector added 16,100 positions (+10.9%), signalling year-over-year growth. These gains reflect continued momentum in infrastructure and energy-related activity, even as employers contend with elevated input costs and trade-related uncertainty.
The sector’s GDP contribution peaked at $48.3 billion in early 2025 but declined to $45.4 billion by June, driven by seasonal demand fluctuations and broader cooling across goods-producing industries.[11]
Regional Employment Trends
Provincial employment shifts in August highlight uneven dynamics across the country. The largest employment gains occurred in:
- Alberta: +4,600 (+23.7%)
- Saskatchewan: +700 jobs (+9.3%)
- Manitoba: +400 jobs (+6.1%)
By contrast, the largest declines were recorded in:
- Ontario: -500 jobs (-0.8%)
- Quebec: -400 jobs (-1.1%)
- Newfoundland and Labrador: -300 jobs (-12.5%)
Wage Trends
In August 2025, average weekly wages in the utilities sector reached $2,083, remaining significantly above the national average across all industries ($1,342). However, this represents a 0.6% decline from July, when utilities wages stood at $2,096.
- Highest wage: Ontario
- Lowest wage: Manitoba at $1,616, approximately 22% below the national utilities average.
Note: Data for PEI were suppressed by Statistics Canada to meet confidentiality reasons.
Across all industries, the average weekly wage rose by $4 from July (+0.3%), and is up $38 (2.9%) compared to August 2024. This modest growth reflects a broader trend of wage stability, even as headline inflation eases and cost pressures persist across sectors.
Table 2: Utilities Sector Employment (in 000s) by Province, August 2024, July 2025 and August 2025 (Seasonally Adjusted)[12]
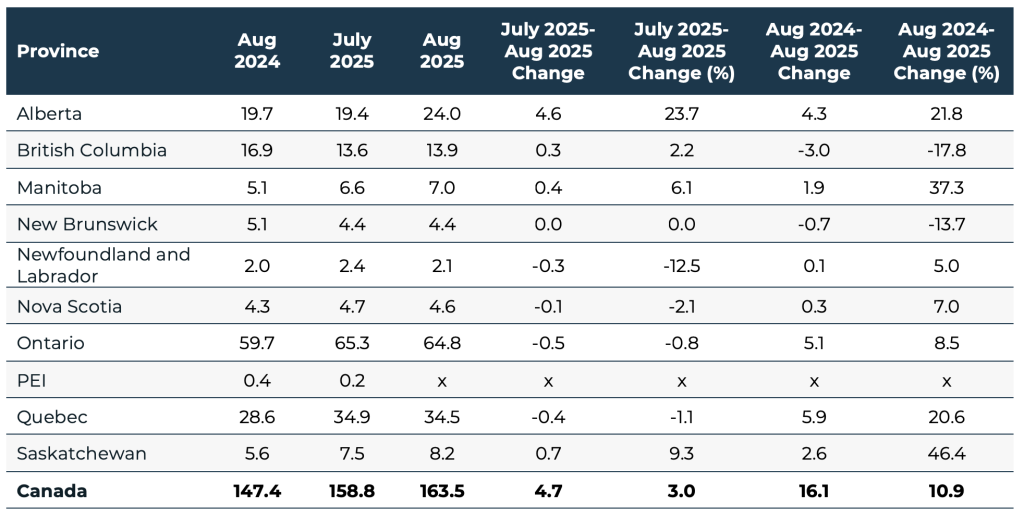
*Please interpret these figures with caution, as EHRC has not independently verified their accuracy.
X: suppressed to meet the confidentiality requirements of the Statistics Act
Figure 4: Average Weekly Wage Rates in the Canadian Utilities Sector, July 2024-July 2025[13]
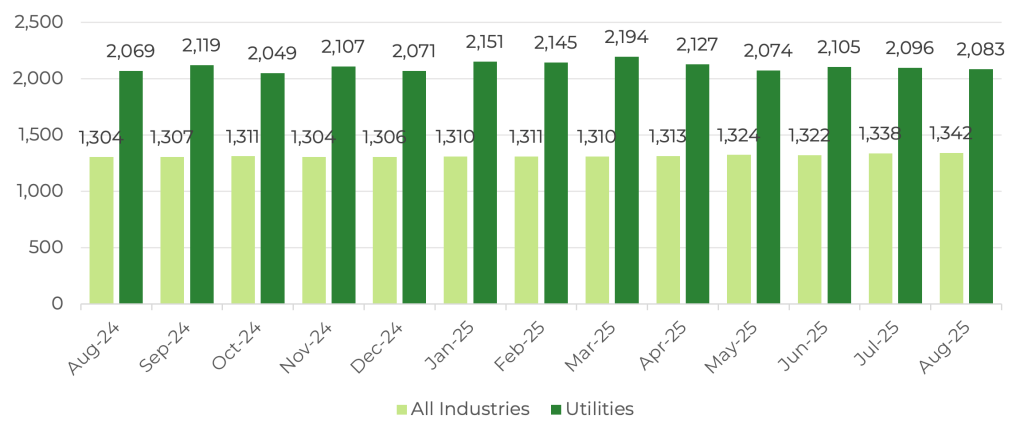
Figure 5: Average Weekly Wage Rates ($) in the Canadian Utilities Sector, by Province, August 2025[14]
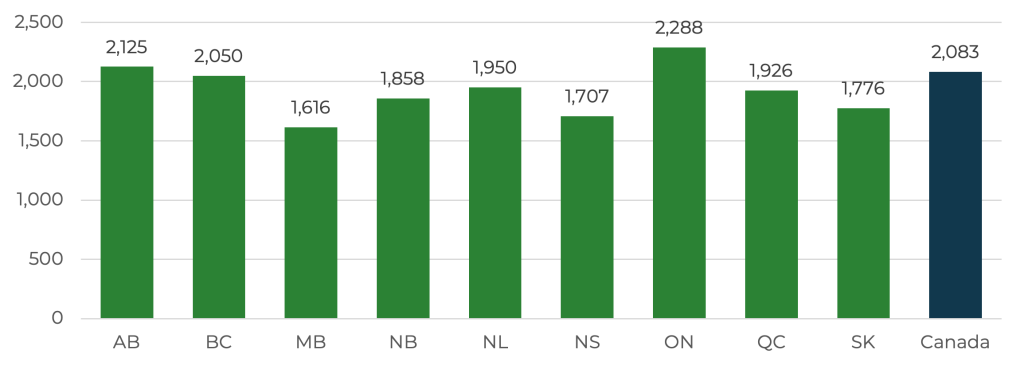
Note: Statistics Canada did not provide wage data for PEI for August.
Endnotes
[1] Statistics Canada. (2025, August). Impact of tariffs on businesses in Canada: Expectations and strategic responses, second quarter of 2025 (Catalogue No. 11-621-M2025007). https://www150.statcan.gc.ca/n1/pub/11-621-m/11-621-m2025007-eng.htm
[2] Statistics Canada. (2025, July). Canadian Economic News, July 2025 Edition. https://www.statcan.gc.ca/en/dai/btd/cen/jul2025
[3] https://www.bankofcanada.ca/rates/price-indexes/cpi/
[4] https://www150.statcan.gc.ca/t1/tbl1/en/tv.action?pid=1410034201
[5] https://www150.statcan.gc.ca/t1/tbl1/en/tv.action?pid=1410028703&pickMembers%5B0%5D=3.1&pickMembers%5B1%5D=4.6&cubeTimeFrame.startMonth=08&cubeTimeFrame.startYear=2025&referencePeriods=20250801%2C20250801
[6] https://www150.statcan.gc.ca/t1/tbl1/en/tv.action?pid=1410008601&pickMembers%5B0%5D=2.3&pickMembers%5B1%5D=4.6&pickMembers%5B2%5D=5.1&pickMembers%5B3%5D=6.1&cubeTimeFrame.startMonth=04&cubeTimeFrame.startYear=2025&cubeTimeFrame.endMonth=08&cubeTimeFrame.endYear=2025&referencePeriods=20250401%2C20250801
[7] Statistics Canada. Table 14-10-0287-01 Labour force characteristics, monthly, seasonally adjusted and trend-cycle
[8] Statistics Canada. Table 14-10-0287-01 Labour force characteristics, monthly, seasonally adjusted and trend-cycle
[9] https://www150.statcan.gc.ca/n1/pub/14-20-0001/142000012018001-eng.htm
[10] Statistics Canada. Table 14-10-0287-03 Labour force characteristics by province, monthly, seasonally adjusted
[11] https://tradingeconomics.com/canada/gdp-from-utilities
[12] Statistics Canada. Table 14-10-0355-01 Employment by industry, monthly, seasonally adjusted and unadjusted, and trend-cycle, last 5 months (x 1,000)
[13] Statistics Canada. Table 14-10-0063-01 Employee wages by industry, monthly, unadjusted for seasonality
[14] Statistics Canada. Table 14-10-0063-01 Employee wages by industry, monthly, unadjusted for seasonality